
Hello, Eco-Enthusiasts!
Know exactly where it goes.
Every. Single. Time.
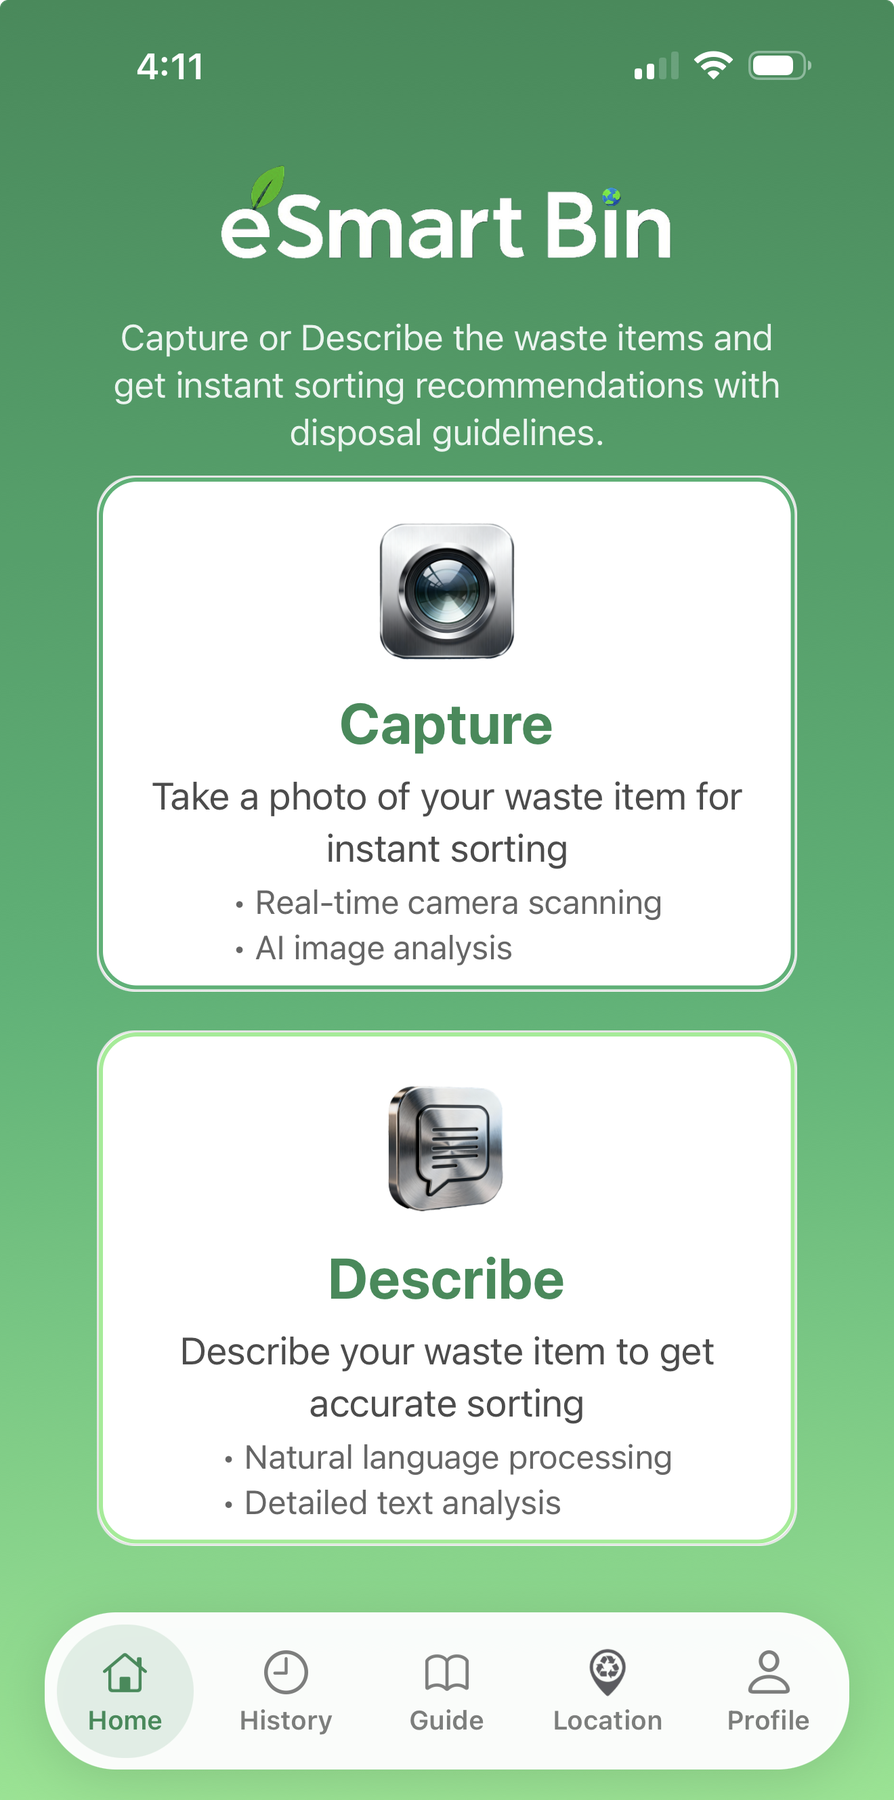
Great accuracy across everyday waste. Snap a photo or describe your item and get instant classification in seconds.



The Scale of Our Waste Problem
Understanding the magnitude helps us realize why every sorting decision matters
What Makes Up Our Waste?
46% of waste is food and garden waste that could be composted, yet only 6% of all waste is composted or digested. Food rotting in dumps and landfills produces methane gas.
Source: World Bank, What a Waste 3.0 (2026) — municipal solid waste, 2022 data.
Wrong Sorting vs Right Sorting
One simple decision at the bin can have massive environmental consequences
Wrong Sorting
Landfill Overflow
42%of the world's waste ends up in landfills or open dumps
⚠️ Rotting food there releases methane
Recycling Losses
40%of plastic collected for recycling worldwide is never actually recycled (OECD)
⚠️ Burned, landfilled or dumped instead
Wasted Energy
95%of the energy needed to make new aluminium is saved by recycling aluminium (IAI)
⚠️ Unnecessary carbon emissions
Result: Overflowing landfills, pollution, and wasted resources
Right Sorting
Resource Recovery
75%of all aluminium ever produced is still in use today (IAI)
✓ Reduces need for raw materials
Emission Reduction
29%lower GHG emissions from solid waste in 2050 than in 2022 (World Bank, high-ambition scenario)
✓ Fights climate change
Landfill Diversion
68%of global waste is food, garden waste, paper & cardboard, glass or metal — materials widely composted or recycled
✓ Less need for landfill space
Result: Sustainable future, cleaner planet, preserved resources
Material-by-Material Impact
The Landfill Crisis
Landfills remain the most common way the world manages its waste, and on current trends yearly municipal waste is projected to grow 50%, to 3.86 billion tonnes, by 2050 (World Bank).
See Your Personal Environmental Impact
Discover how many items you sort correctly and the difference you're making
How many items do you throw away daily?
Pick a rough count. For scale, municipal waste in most countries comes to 0.57–1.38 kg per person a day (World Bank, 2022 data)
Est. CO₂e Avoided
≈ 50 g CO₂e per sorted item (eSmart Bin estimate)
Your Yearly Impact with Proper Sorting
items sorted correctly
Achievement Milestones




Start your journey to becoming a Planet Legend
Download eSmart Bin NowHow accurate is eSmart Bin?
Transparency and continuous improvement are at the heart of what we do

HOW ACCURATE IS IT?
eSmart Bin gets everyday items right most of the time, but it is guidance, not a guarantee. Items made of complex materials, like multi-layer packaging or composite products, are harder for it to place — always follow the rules of your local council or waste collector.

ALTERNATIVE FEATURES
For complex items, you can use our describe feature to type exactly what you're disposing of, or browse the in-app "What Goes Where?" guide.

CONTINUOUS IMPROVEMENT
If a result comes back inaccurate, you can always tap the "I'm an Eco-Friend!" button to describe what was wrong so that our AI can improve. This also helps us get better over time!

OUR COMMITMENT
Making waste management smarter and more sustainable through AI-powered classification technology to make the world cleaner, one classification at a time.
Data Sources & Citations
Environmental statistics on this page come from the organisations listed below. We believe in transparency and scientific accuracy.
World Bank - What a Waste 3.0
Global waste generation, treatment and projections (2022 data)
UNEP - Global Waste Management Outlook 2024
Where the world's municipal waste goes, including landfill (2020 data)
OECD - Policy Scenarios for Eliminating Plastic Pollution by 2040
Plastic collected for recycling vs. actually recycled (2020 data)
International Aluminium Institute
Aluminium recycling energy savings and metal still in use
IPCC Sixth Assessment Report (AR6)
Methane's warming effect compared with CO₂
Climate TRACE
Landfills and dumpsites tracked worldwide
FEVE - European Container Glass Federation
Glass recyclability
Our Commitment to Accuracy
Note: Apart from the calculator's estimate, each environmental statistic on this page comes from one of the sources above; waste totals and shares are from the World Bank's What a Waste 3.0 (2026; 2022 data and 2050 projections) unless another source is named. The personal impact calculator is illustrative: it uses eSmart Bin's own estimate of about 50 g of CO₂e avoided per sorted item, the same factor the app uses, not a measured value. We regularly update our data sources to ensure accuracy and relevance.
CLAIM 5 FREE SCANS UPON SIGN UP!
Start your sustainable waste management journey today - 5 free scans when you sign up